The mainflow Data Manager module is designed to make the process of data representation and interaction quick, easy and intuitive
USE THE DATA MANAGER MODULE TO BUILD POWERFUL REPORTS
Connect your relevant business data from all Mainflow modules to the Data Manager module and easily build and display powerful reports to your audience. Be it workflow performance KPI’s, sales pipeline numbers, marketing efficiency and anything in between
CORE FEATURES
Reports for Your Users
Build and insert interactive tables and charts in any of your Mainflow pages with such features as multi-criteria filtering, sorting, or export to PDF. Tables can be created from virtually any data source
User Editing of Tables
Create tables that allow front-end editing, popup editor, Inline table editing in an Excel-like editor.
Allow users to see and edit only their own data
Various Data Sources
Display data in the frontend by easily integrating to; Excel files
CSV files; Google Sheets;
MySQL queries; JSON feeds; Serialized PHP arrays and mainflow modules
Display Data Formats
Easily configure display of various data formats in Mainflow Data Manager. Be it; Text String, Numbers, Dates and DateTime, Images, URLs or E-mails
Beautiful Charts for Reporting
Create great looking charts and business reports using the create wizard. Use HighChart, ApexCharts, Google charts, and Chart.js
20+ Advanced Displays
Create and update tables from source files, use JSON Authentication, deploy conditional formatting, customize tables, use sorting, advanced filtering, pagination and much more
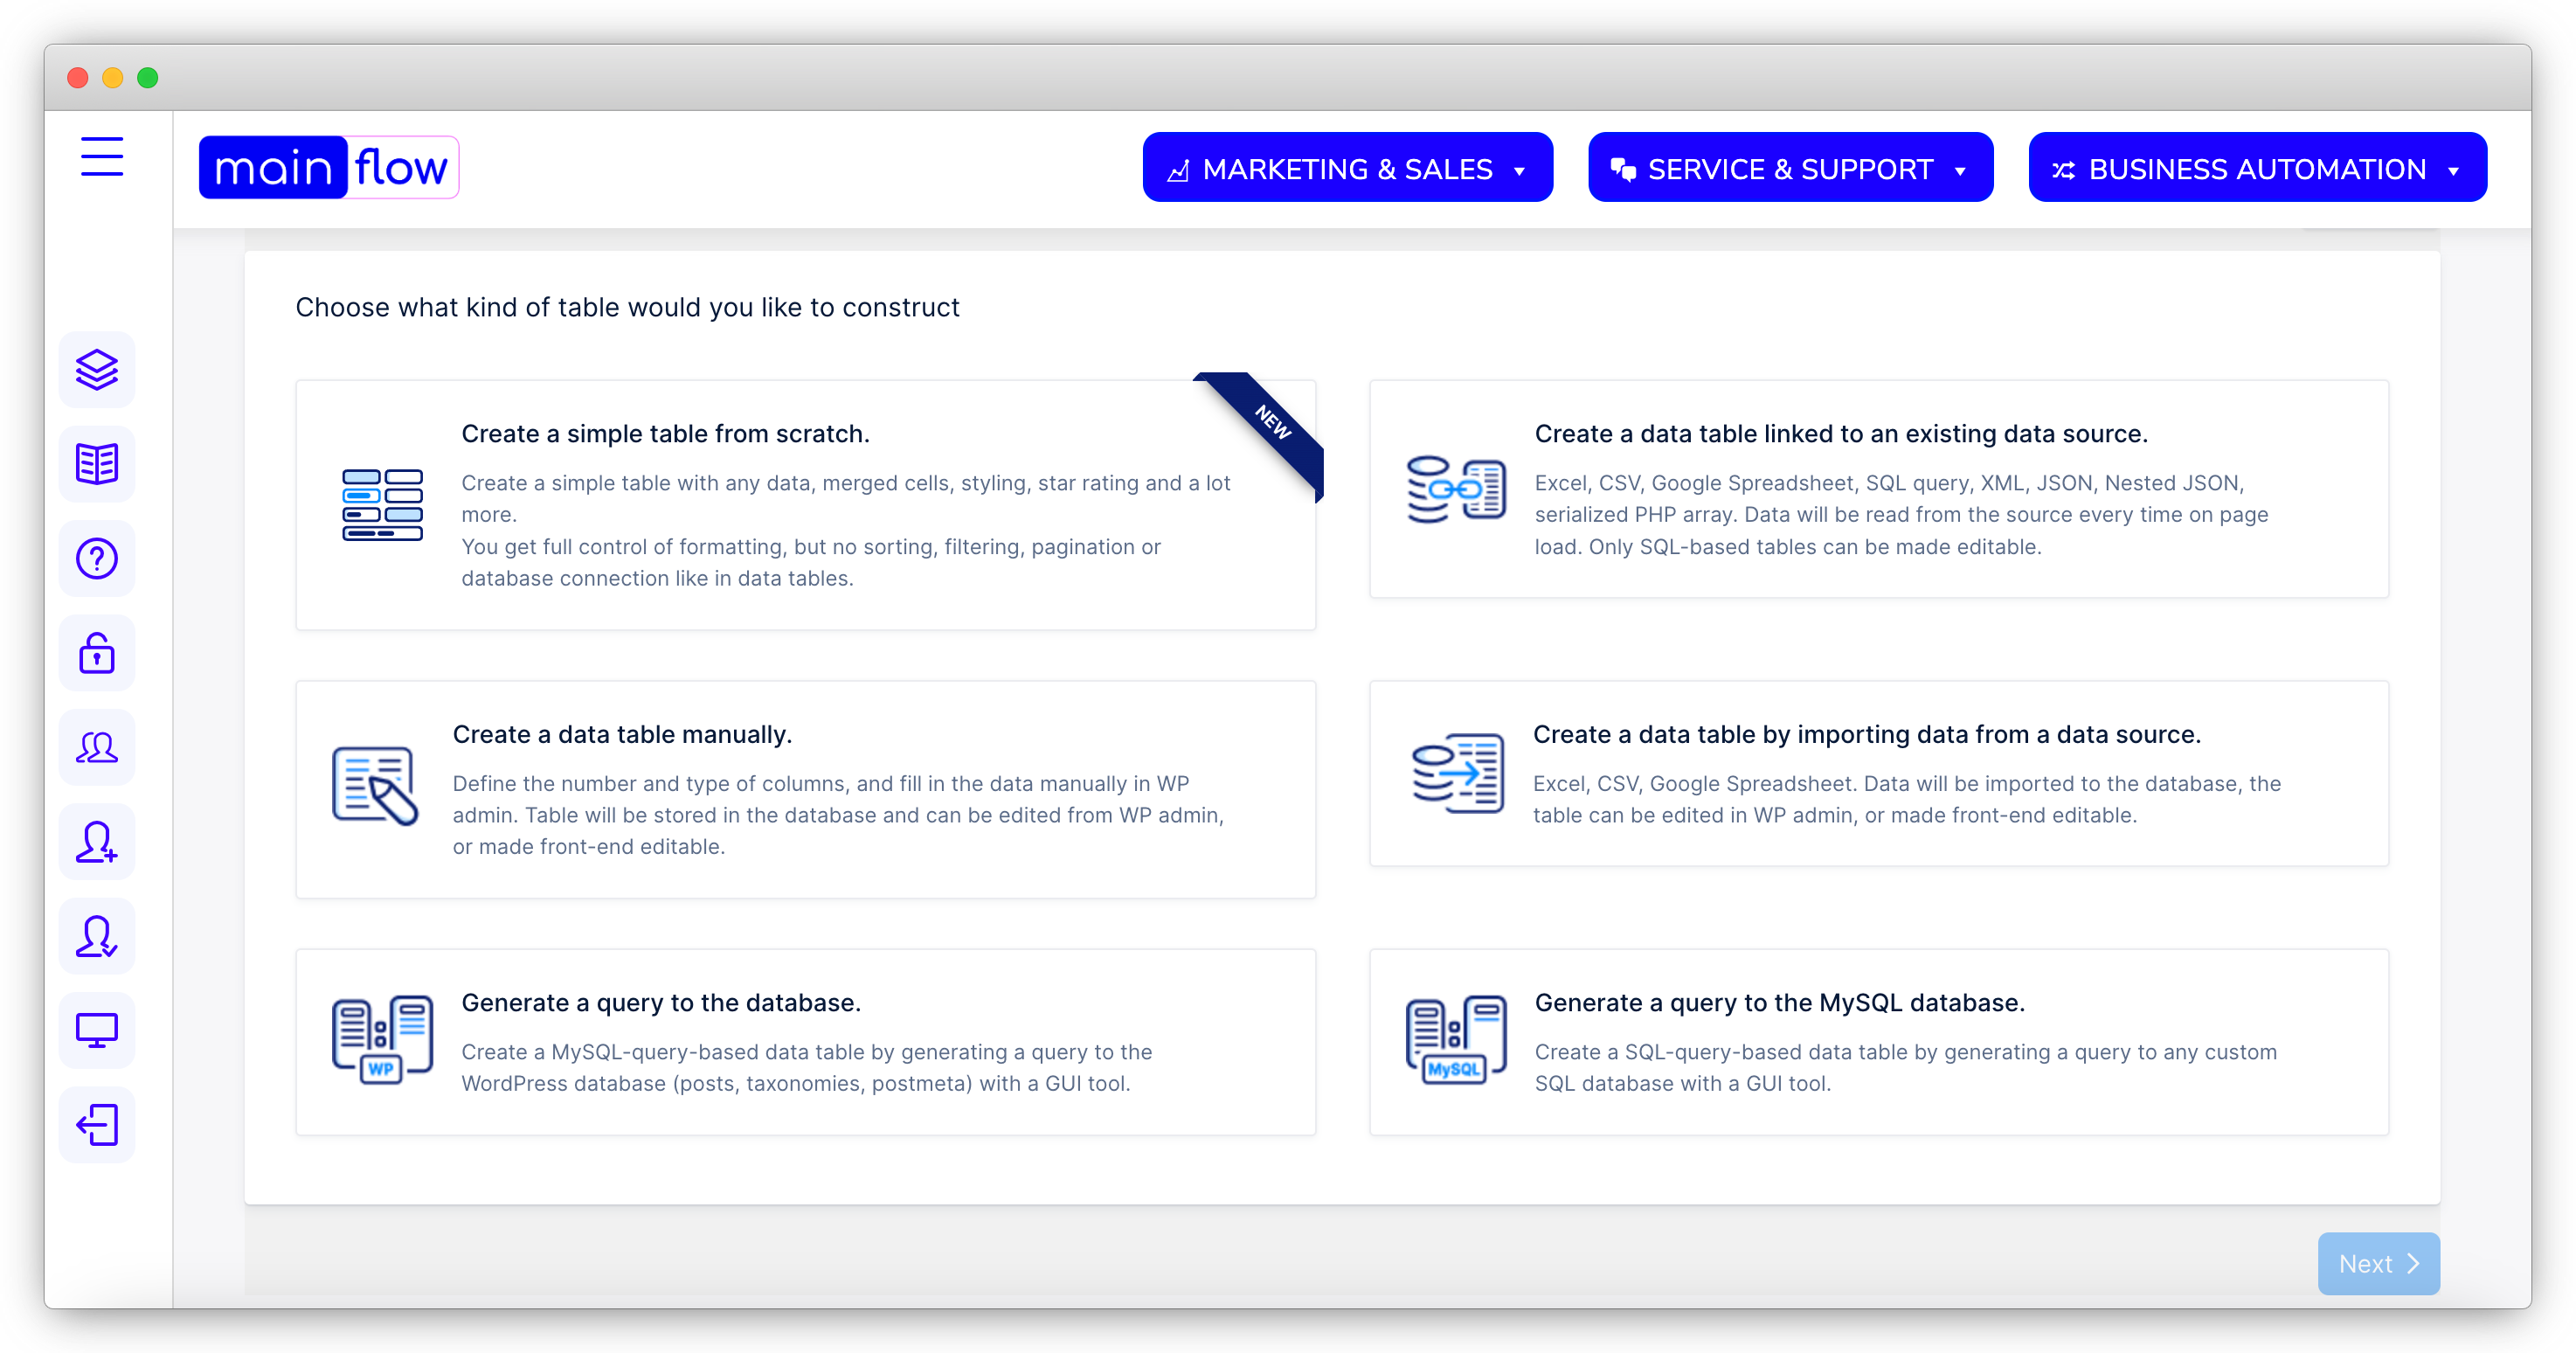
Select and connect to 6 different data sources to build your tables
Mainflow Data Manager is a powerful data management and reporting tool, allowing you to choose to build your tables and charts from various sources. Choose to build a table from an integrated import, build it right form scratch and manually, integrate to your mainflow database and query that or connect to an online spreadsheet such as Google Sheets or MS Excel 365
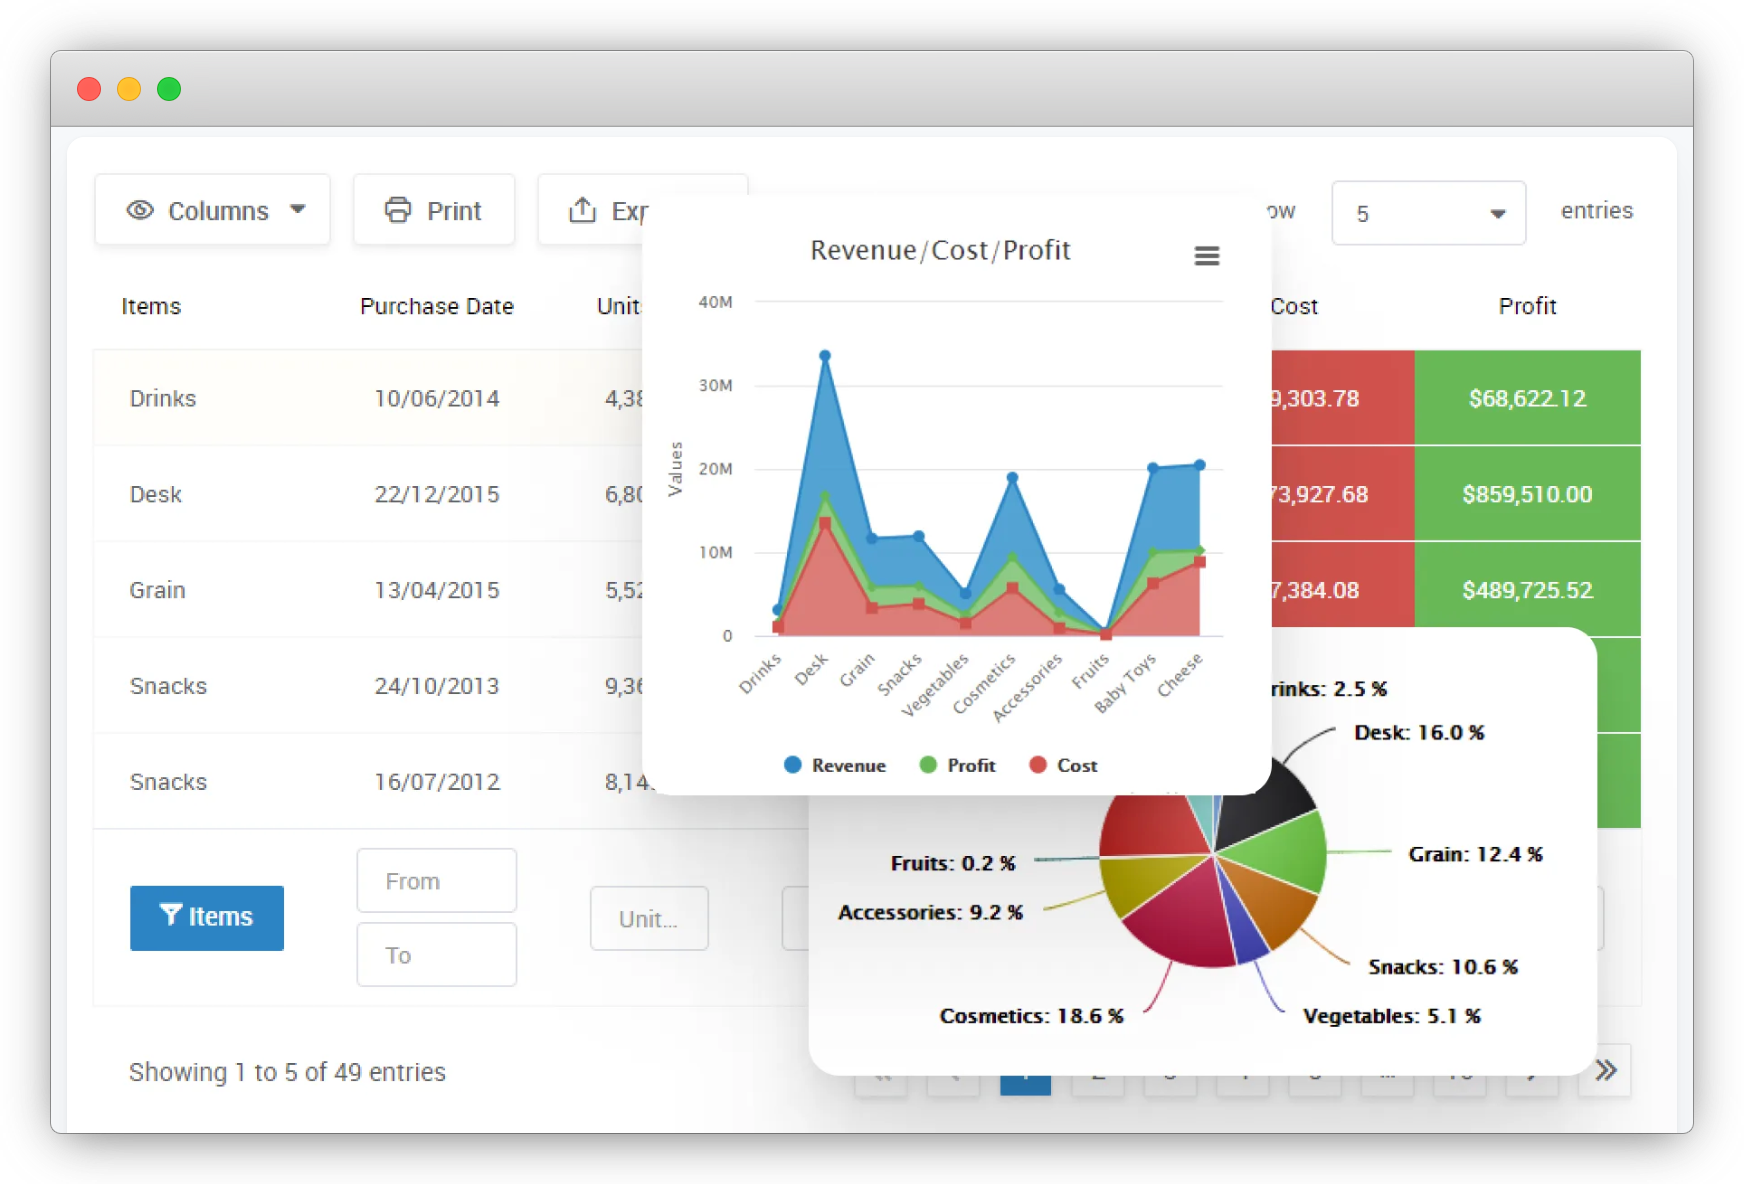
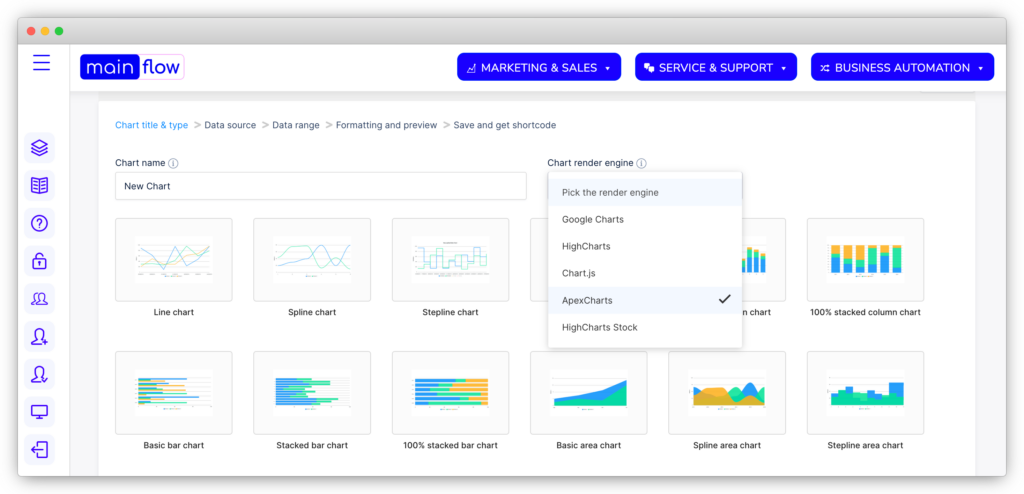
Create visually striking charts that are intuitive to understand
Create a chart by connecting it to one of your defined datatables and build a powerful report from that. Choose between 5 different and powerful chart rendering engines such as Google Charts, HighCharts, Chart.js, ApecCharts and HighCharts Stock. Any of the chart rendering engines will allow you to build great looking charts that can easily be deployed on any mainflow page
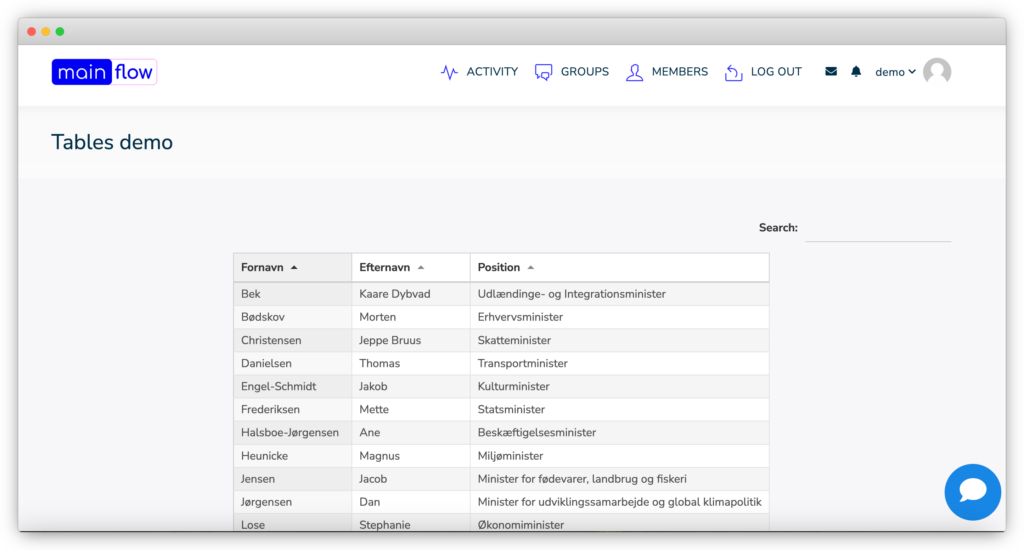
Add Tables & Charts to a live webpage for easy accessibility for your audience and stakeholders
Take advantage of the combination of the Data Manager + UI Designer module and publish your charts and reports on a live webpage. If need be, you can easily password protect your business reports with a password or by user role or limit access to specific users only
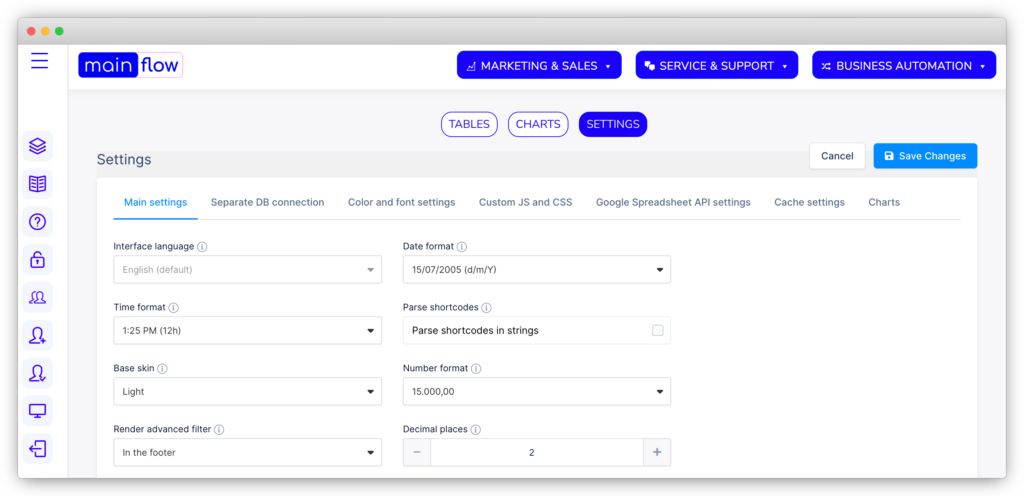
Control anything from the Settings panel. Language, date format, skin etc
Make the most with the granular controls inside the Mainflow admin panel. There are numerous settings for the Data Manager that you can use to change the color and look of your tables and charts, define date format, default currency, time format, number format, fonts, font color and much more. And if the controls are not enough, you can also style the charts and tables yourself using CSS